New Pathfinder Data Options to Assist with Coronavirus Scenario Modeling
The features described in this article are now available in Pathfinder 2020.2 and later versions.
The global spread of the SARS-CoV-2 virus and associated COVID-19 sickness has profoundly changed human interactions in a matter of weeks. It will likely be several more weeks until the first wave of illness is under control.
Modeling how these interactions affect our environment will provide insight into what can be done to improve public safety now and in the future. Thunderhead Engineering has implemented additional analysis tools in Pathfinder to assist with evaluation of various human movement scenarios.
Discussions with current customers that perform crowd modeling led us to focus initially on improved data output and visualization related to the minimum distance between agents in a simulation. Maximizing the closest distance between occupants and minimizing the total number of occupants encountered has the potential to reduce overall risk when comparing alternative layouts or procedures for a space.
These changes are the beginning of rapid development in Pathfinder intended to help model and visualize important emerging scenarios:
- Immediate changes to public spaces will need to be vetted quickly to determine the best methods of reducing transmission.
- After the first wave, governments, factory managers, and administrators of public spaces will need tools to evaluate risk levels and exposure as these spaces are slowly reopened at reduced capacity.
- Increased physical distance within commercial and public spaces will likely be needed for several months.
- As pockets of illness reappear, space planners will want to be prepared with alternate plans that can minimize virus transmission while avoiding widespread full closures of facilities.
 Pathfinder Changes
Output Data for Social and Physical Distancing
In this preview build, Pathfinder.exe supports a new command-line parameter:
-J-Dsocial_distance=2.0
(2.0 is a value in meters that can be adjusted to control some of the following features)
This parameter activates writing of the following new data files:
CSV-format output file
<modelname>_sd_transient.csvcontaining transient data about occupant separation. For every time and occupant in the simulation, the closest other occupant is listed along with distance. Additionally, the number and ID of occupants within 1m, 2m, and 3m are also listed. The presence of the social_distance command line parameter is required for this output to be generated, however adjusting the numeric value of social_distance has no impact on this output.CSV-format output file
<modelname>_sd_accumulated.csvcontaining accumulated exposure data for each occupant. For every occupant in the simulation, the occupant who has spent the longest time within r=social_distance is listed, including the occupant ID and the total amount of time. Additionally, a count is made of all occupants who have remained within social_distance of the occupant for more than 1 minute and 5 minutes, including the occupant IDs.
Graphical Depiction of Social/Physical Radius
When Pathfinder.exe is run with the social_distance command-line flag, Results will display a disk at the base of each occupant whose radius is social_distance meters. In addition, a Debug menu will appear on the menu bar enabling the use of the Edit Debug Options… dialog where you can edit the value of Social Radius (note: set the value to zero to disable this setting).
New Occupant Contours to Quantify Exposure
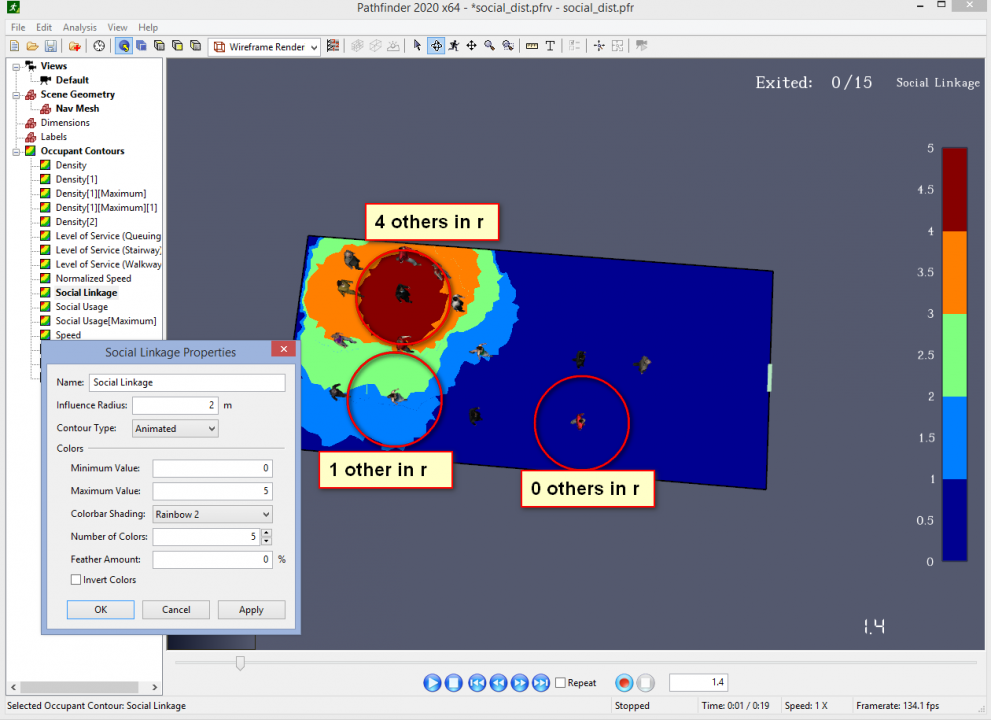
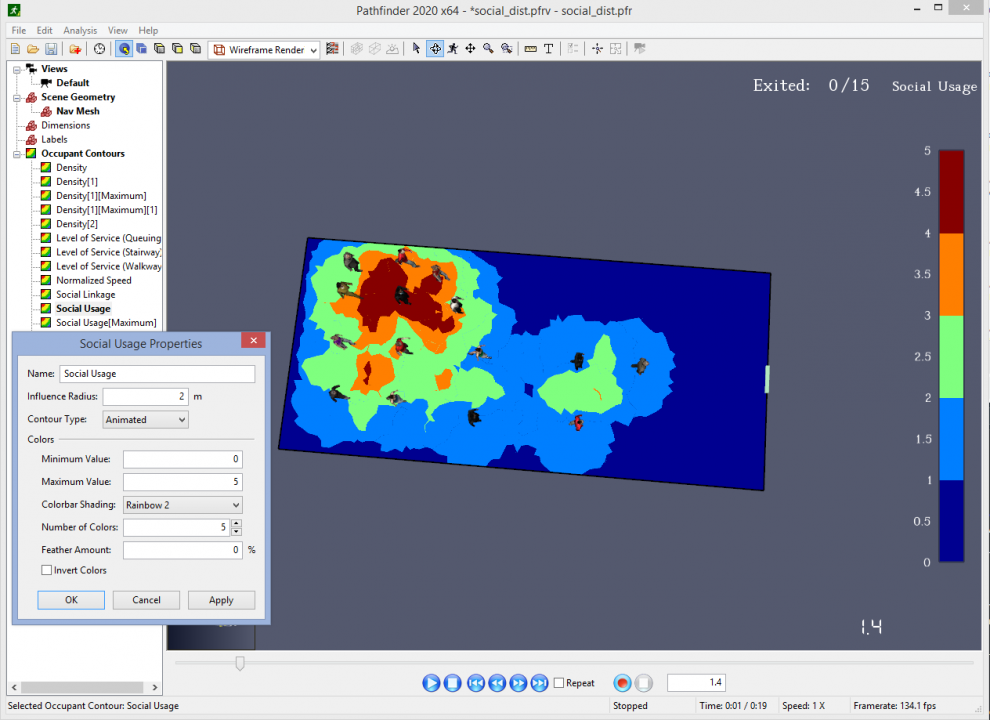
We have implemented two new Occupant Contours in the Pathifnder Results viewer that may help evaluate physical distance between occupants – currently named Social Linkage and Social Usage.
- Social Linkage uses a given radius (R) to calculate how many other agents are within that radius and plots that as the value drawn inside a circle of radius R centered at the occupant. Higher values display on top of lower values. We are also considering displaying this measure as a per-occupant color for greater clarity.
- Social Usage is similar to a density contour and is referenced to the contour mesh. For every point on the mesh (conceptually a spot on the floor), the number of agents within radius R are calculated and assigned to that mesh point. The mesh of all values is then contoured. This will give the high values between the agents rather than right at the agents.
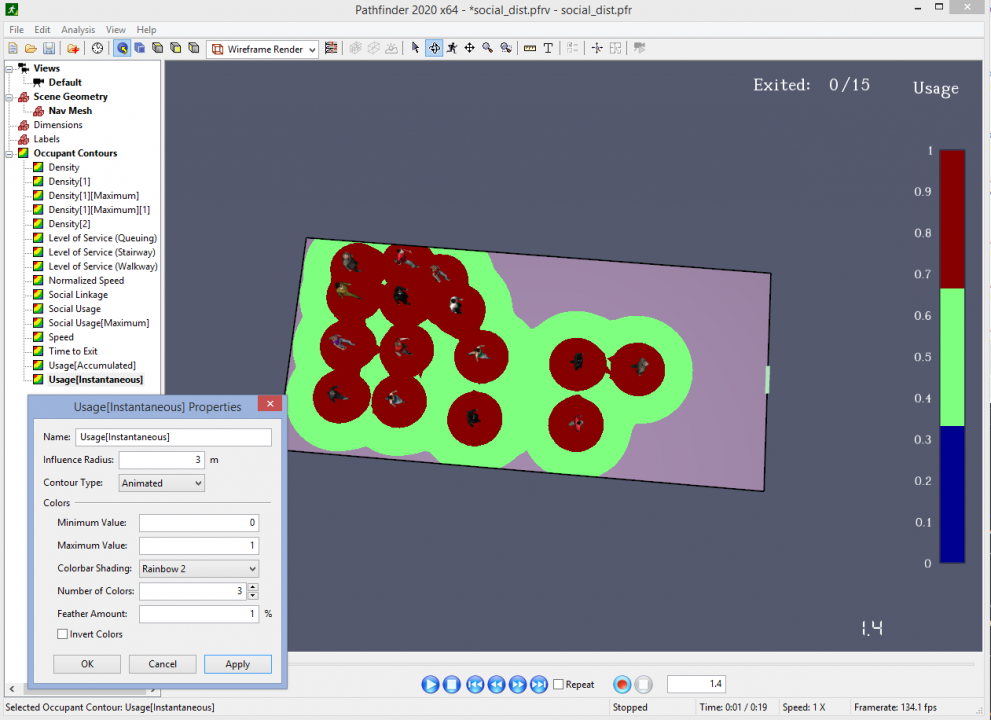
It is also possible to use the existing Density or Usage contours in Pathfinder to show different data if you consider how the calculation is done and what scale is used. Since the Usage contour assigns a value that ranges linearly from 1 at the agent location to 0 at radius r, it can be used to draw range rings. In this example with r=3 and three color bar segments, the green circle represents 2m from the occupant and red shows 1m.
Additionally, all contours can be passed through filters to display average or maximum values over time.
Help with future development of Pathfinder
These preview features were preliminary and available before an official release of Pathfinder. The features described in this article are now available in Pathfinder 2020.2 and later versions. Our goal was to make these updated data options available as soon as possible for anyone evaluating procedures and space usage during the current crisis.
If you have additional suggestions, we encourage you to contact support@thunderheadeng.com.


